Add note on Term.jl - rework layout docs
#258
Conversation
|
That's so cool, I'm glad you like it!
So I was initially thinking of having a Is that what you did to generate the examples above? P.s.: Once you've released this, would it be okay if I tweet about it? It's such a beautiful use case for Term.jl! |
|
Didn't expect it worked out so smoothly 🎉
|
I've updated the comment in #258 (comment) to show the code used (landing in README.md) But with using UnicodePlots, Term
print(
Panel(lineplot([cos, sin], -π/2, 2π); title="lineplot", style="yellow", fit=true) *
Panel(contourplot(-3:.01:3, -7:.01:3, (x, y) -> exp(-(x / 2)^2 - ((y + 2) / 4)^2)); title="contourplot", style="red", fit=true) *
Panel(surfaceplot(-8:.5:8, -8:.5:8, (x, y) -> 15sinc(√(x^2 + y^2) / π)); title="surfaceplot", style="blue", fit=true) / (
Panel(histogram(randn(1_000_000), nbins=100, vertical=true); title="histogram", style="green", fit=true) *
Panel(densityplot(randn(1_000), randn(1_000)); title="densityplot", style="cyan", fit=true)
)
)
Sure, go ahead !
🚀 🚀 🚀 |
|
awesome, thanks! |
Btw, this PR is only documentation, the |
|
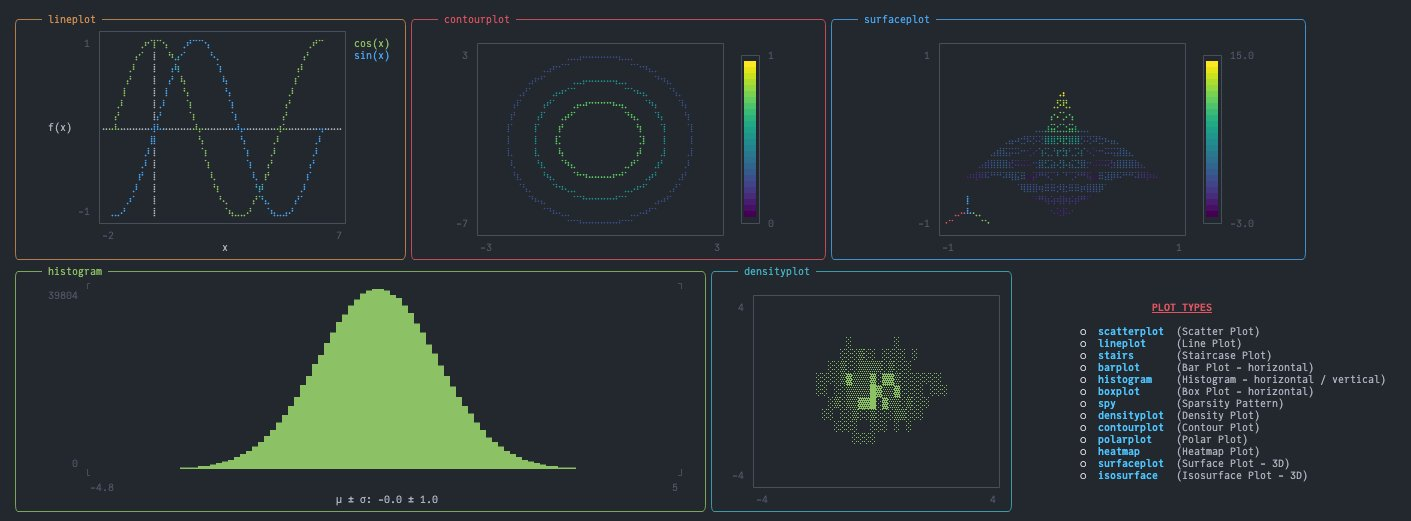
Not sure if you're on twitter: https://twitter.com/Federico_claudi/status/1526297003797487616?s=20&t=_6SvMX84Q6VHuBX_hbLphQ I like the idea of mixing plots and text using Term, feels like you can write a whole paper (or PhD Thesis @johnnychen94 ) in the terminal now: Btw this is the code for it, I've added a bit of padding etc to make the layout more uniform: using UnicodePlots, Term
panel(plot; kw...) = Panel(string(plot, color=true); fit=true, kw...)
print(
panel(
lineplot([cos, sin], -π/2, 2π); title="lineplot", style="yellow"
) * panel(
contourplot(-3:.01:3, -7:.01:3, (x, y) -> exp(-(x / 2)^2 - ((y + 2) / 4)^2)); title="contourplot", style="red", padding=(4, 8, 1, 0),
) * panel(
surfaceplot(-8:.5:8, -8:.5:8, (x, y) -> 15sinc(√(x^2 + y^2) / π)); title="surfaceplot", style="blue", padding=(11, 8, 1, 0)
) / (
panel(
histogram(randn(1_000_000), nbins=100, vertical=true); title="histogram", style="green"
) * Panel(
string(densityplot(randn(1_000), randn(1_000)); color=true); title="densityplot", style="cyan", fit=true, padding=(0, 0, 1, 0)
) * TextBox(
"""
[bold red underline]PLOT TYPES[/bold red underline]
[white]⚪[/white] [bold bright_blue]scatterplot[/bold bright_blue] (Scatter Plot)
[white]⚪[/white] [bold bright_blue]lineplot[/bold bright_blue] (Line Plot)
[white]⚪[/white] [bold bright_blue]stairs[/bold bright_blue] (Staircase Plot)
[white]⚪[/white] [bold bright_blue]barplot[/bold bright_blue] (Bar Plot - horizontal)
[white]⚪[/white] [bold bright_blue]histogram[/bold bright_blue] (Histogram - horizontal / vertical)
[white]⚪[/white] [bold bright_blue]boxplot[/bold bright_blue] (Box Plot - horizontal)
[white]⚪[/white] [bold bright_blue]spy[/bold bright_blue] (Sparsity Pattern)
[white]⚪[/white] [bold bright_blue]densityplot[/bold bright_blue] (Density Plot)
[white]⚪[/white] [bold bright_blue]contourplot[/bold bright_blue] (Contour Plot)
[white]⚪[/white] [bold bright_blue]polarplot[/bold bright_blue] (Polar Plot)
[white]⚪[/white] [bold bright_blue]heatmap[/bold bright_blue] (Heatmap Plot)
[white]⚪[/white] [bold bright_blue]surfaceplot[/bold bright_blue] (Surface Plot - 3D)
[white]⚪[/white] [bold bright_blue]isosurface[/bold bright_blue] (Isosurface Plot - 3D)
""", padding=(2, 2, 1, 0)
)
)
) |
We only lack LaTeX there ... All the existing solutions require rendering latex code to an image (and additional sixel encoding for enhanced resolution): https://discourse.julialang.org/t/latex-rendering-in-the-julia-repl/43473/9 How does |
|
It would be awesome to have Latex in the terminal, but not sure how feasible it is. I think you do have to go through an image as you can't have an unicode symbol for everything (though see this python package). I've never looked into how images are rendered in the terminal, I've got no idea how it works it seems like magic to me. I'm sure @johnnychen94 knows a lot more about it. I haven't tried playing around with that in Term.jl, but if they can be turned into strings it should just work out of the box. Perhaps we can start a discussion on term's repo on how to best integrate it with images libraries? |
|
Let's move the discussion to FedeClaudi/Term.jl#93 |
@FedeClaudi, I only started playing with
Term.jl, this is awesome:I'll update the example when a new release is out, removing the need for
string(plot)as explained in FedeClaudi/Term.jl#86.Fix #256.